ident_linewidth <- 5
ident_disk_size <- 25
ident_textsize <- 40
ident_minor_disk_factor <- sqrt(5)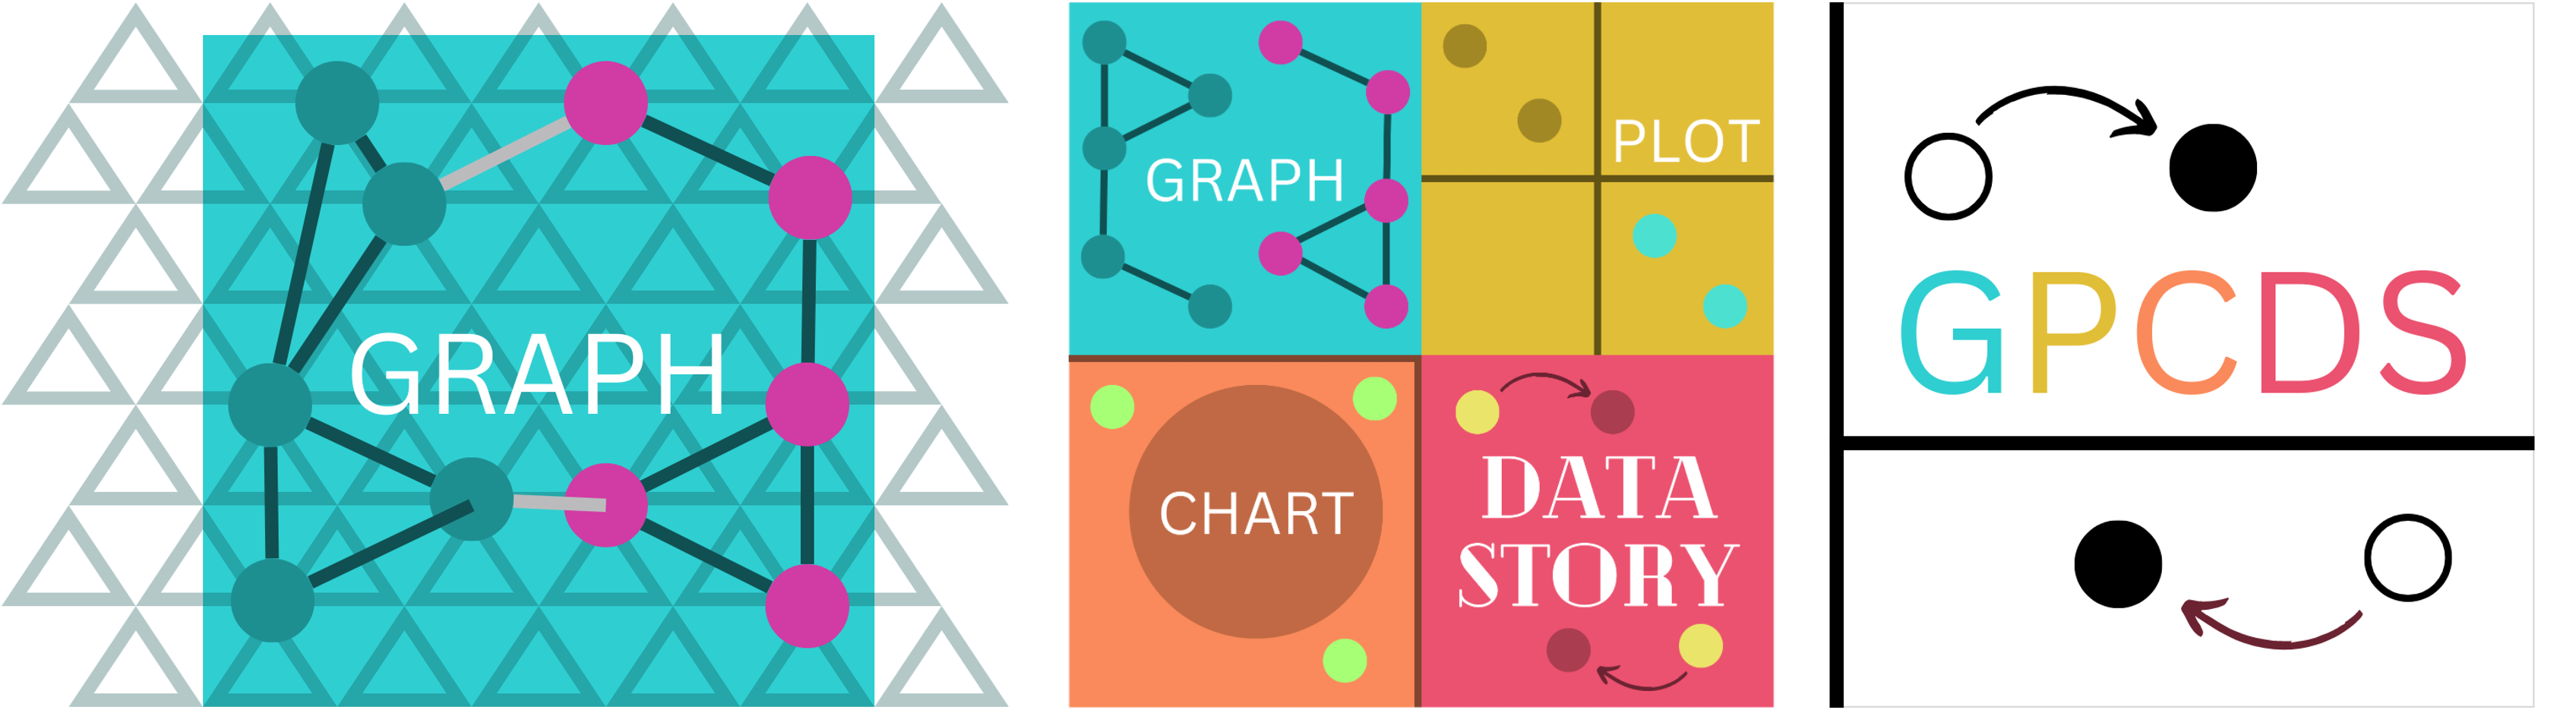
ident_font <- "Futura"At GPCDS we’re purposefully provoking comparisons and challenging assumptions within the field of data visualisation. To evoke the feeling that everything could be categorised and factions exist we wanted to design a cohesive colour palette that gels well but also has clear distinctions within it. Let’s meet the GPCDS palette, idents, logos and wider brand.
Our initial sketches for brand elements back in 2023.
The colours
The primary colours of each category were chosen through the excellent interactive tool https://coolors.co/generate and then the other colours were generated through experimenting with https://color.adobe.com/create/color-wheel. While iterating on the palette we continuously simulated the colours under the most common form of colour blindness - deuteranopia. The chart below shows these 25 colours:
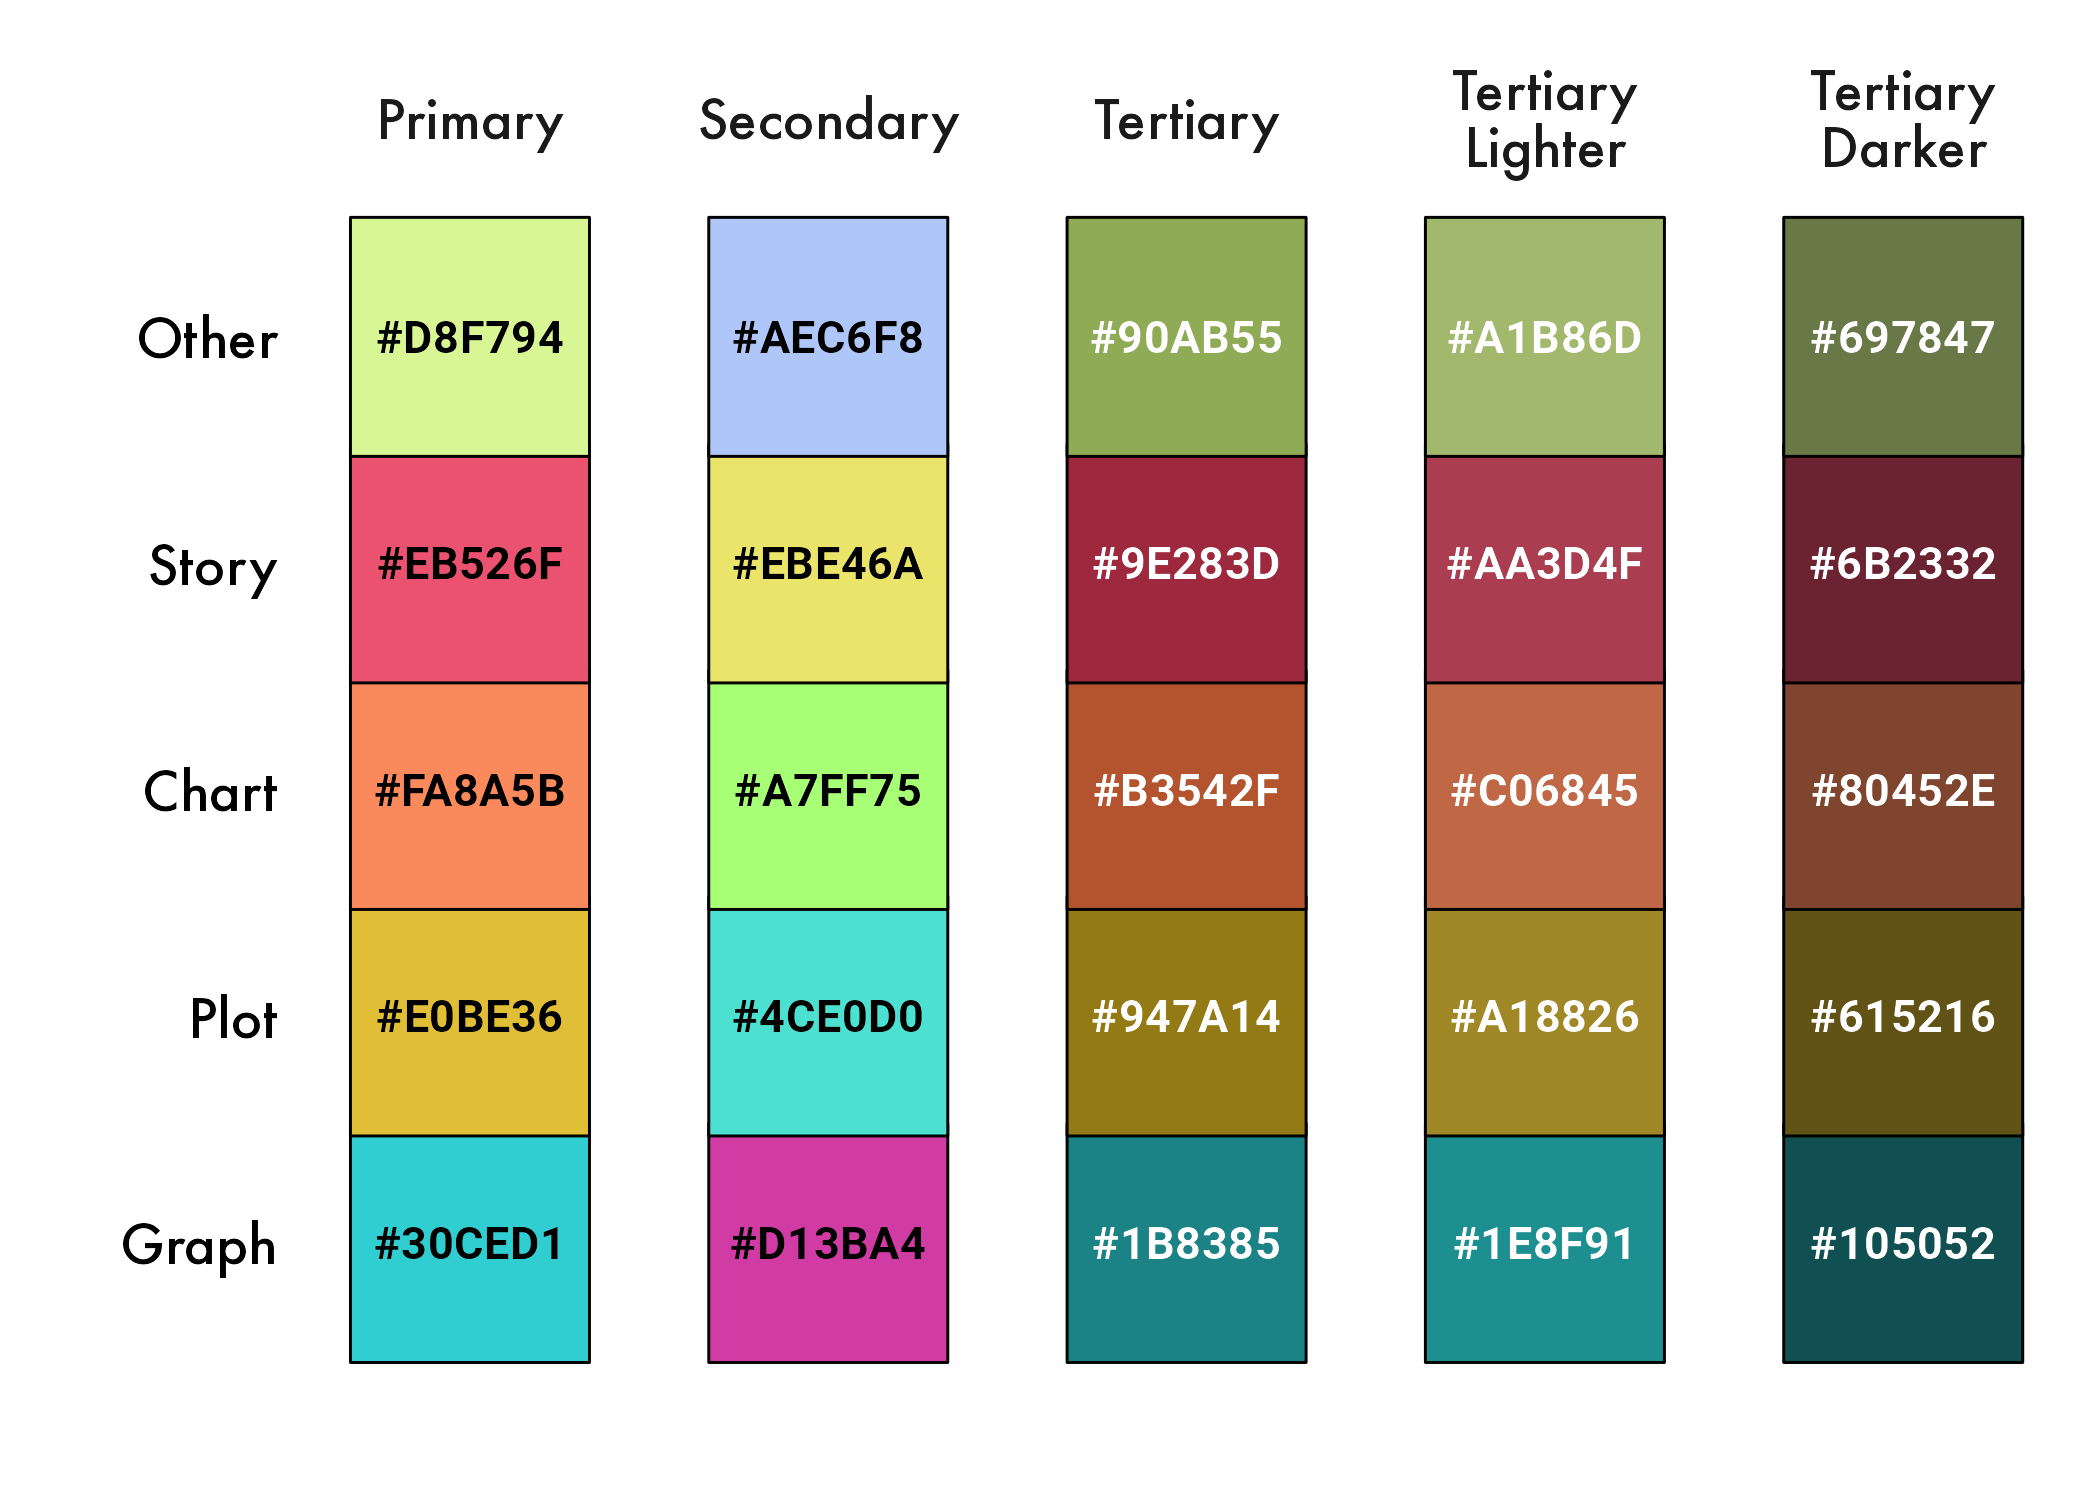
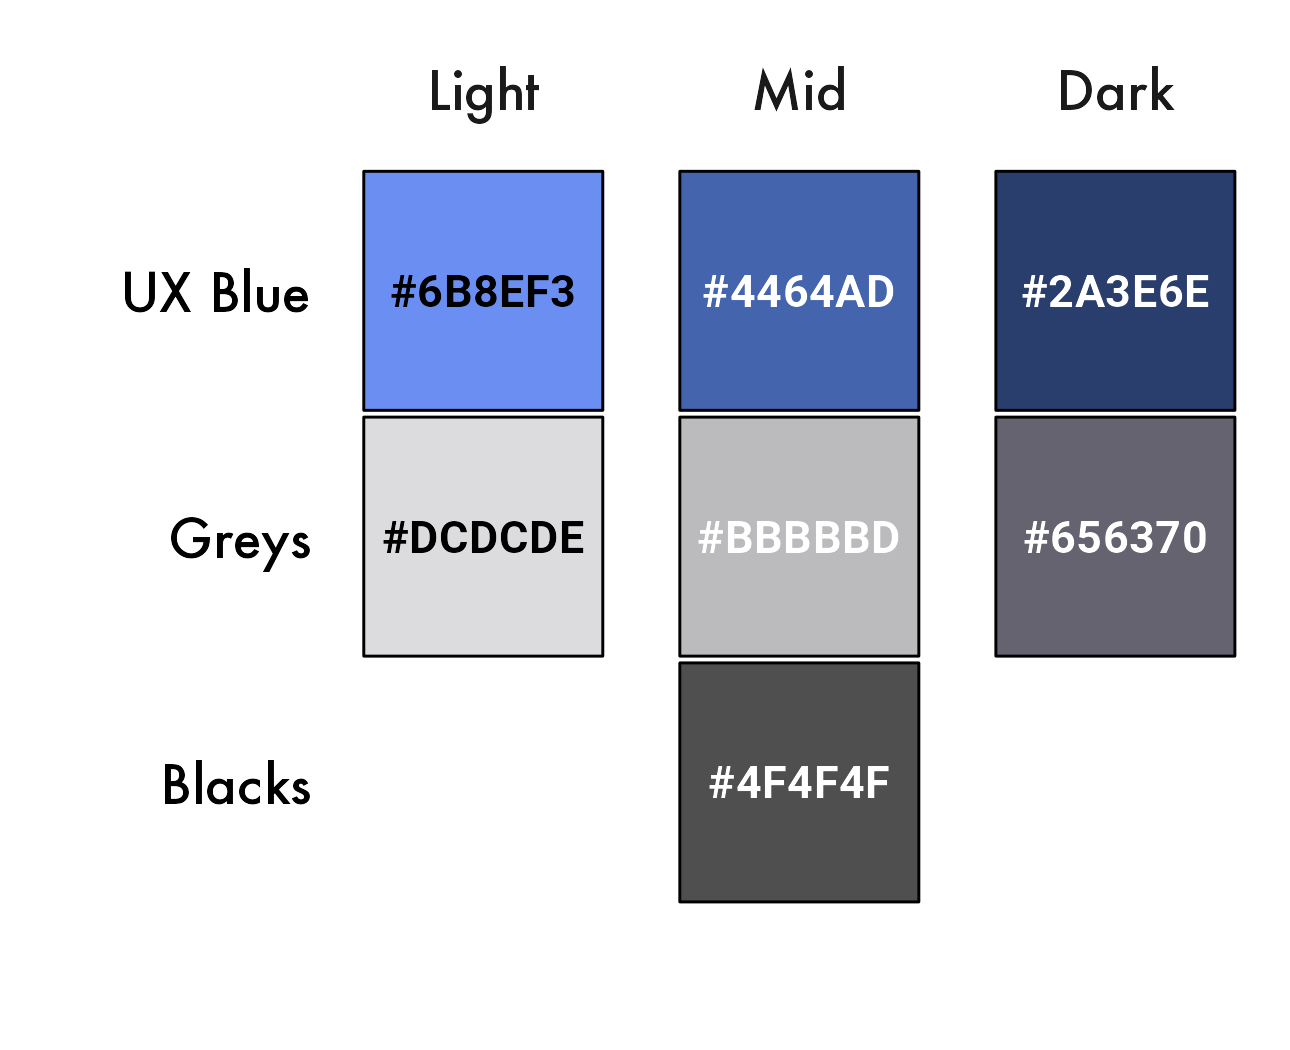
There are 7 additional colours, primarily designed for web elements but could also be used alongside the visualisation category palettes.
RAG indicators are problematic but very popular. Our palette contains 5 colour-blind safe colours from a red-green palette recommended via Andy Kirk’s Visualising Data from this beautiful NPR chart by Alyson Hurt and Katie Park.

Category Idents
Each visualisation category has two “idents” - a major and minor ident.
| Design Element | Major Ident | Minor Ident |
|---|---|---|
| Filled square | Each ident is a 1:1 rectangle filled in the primary colour for the category. | |
| Disks | Each ident contains four disks, two in the secondary colour and the other two in the tertiary colour from the category | Each ident contains two disks, using the secondary and tertiary colour from the category |
| Lines | Each ident contains one or more lines using the tertiary darker colour from the category | Each ident may contain a line using the teriary darker colour from the category |
| Text | Each ident contains the number of the category using the Futura font | Minor idents don’t contain text |
These are the properties of the graphical elments:
As the idents are intended to be displayed in their “four-wise arrangement” they were individually designed to make that layout satisfying. There are notes below about how these decisions were made.


Graphs
The graph idents are simple graphs. In the major graph the edges are either at 180 or 60 degrees to one another, and the closed triad is placed to draw the reader to the cente of the four-wise arrangement.
Code
graph_x_first <- 12.5
graph_y_first <- 50
graph_y_height <- 30

graph_line_1_slope <- tan(60 * pi / 180)
graph_line_2_slope <- tan(-60 * pi / 180)

graph_line_1_intercept <- - {50 + graph_line_1_slope * 50}
graph_line_2_intercept <- - {50 + graph_line_2_slope * {100-graph_x_first}}

graph_bottom_disk_x = {graph_line_2_intercept - graph_line_1_intercept} / {graph_line_1_slope - graph_line_2_slope}

graph_bottom_disk_y = - {graph_line_1_slope * graph_bottom_disk_x + graph_line_1_intercept}

gg_graph_ident_major <- tibble(
  x = c(graph_x_first, 100 - graph_x_first, 50, graph_bottom_disk_x),
  y = c(graph_y_first, graph_y_first, graph_y_first, graph_bottom_disk_y),
  # colour = "secondary"
  colour = c("secondary", "tertiary", "tertiary", "secondary")
) %>%
  ggplot() +
  annotate(
    "segment",
    x = graph_x_first,
    xend = 100 - graph_x_first,
    y = graph_y_first,
    yend = graph_y_first,
    linewidth = ident_linewidth,
    colour = cols_gpcds$graph_tertiary_darker) +
  annotate(
    "segment",
    x = c(50, 100 - graph_x_first),
    xend = c(graph_bottom_disk_x, graph_bottom_disk_x),
    y = c(graph_y_first, graph_y_first),
    yend = c(graph_bottom_disk_y, graph_bottom_disk_y),
    linewidth = ident_linewidth,
    colour = cols_gpcds$graph_tertiary_darker) +
  geom_point(aes(x, y, colour = colour),
           size = ident_disk_size,
           show.legend = FALSE) +
  geom_text(
    x = 50,
    y = 70,
    label = "GRAPH",
    size = ident_textsize,
    colour = "white",
    family = "Futura",
    lineheight = 0.9
  ) +
  scale_colour_manual(
    values = c(
      "secondary" = cols_gpcds$graph_secondary,
      "tertiary" = cols_gpcds$graph_tertiary
    )
  ) +
  scale_x_continuous(expand = c(0, 0)) +
  scale_y_continuous(expand = c(0, 0)) +
  coord_fixed(xlim = c(0, 100), ylim = c(0, 100)) +
  theme_void() +
  theme(
    panel.background = element_rect(
      fill = cols_gpcds$graph_primary,
      colour = cols_gpcds$graph_primary
    )
  )

ggsave(quarto_here("gg_graph_ident_major.png"),
       gg_graph_ident_major,
       width = 8,
       height = 8)
Code
graph_minor_x_first <- 20
graph_y_first <- 50
graph_y_height <- 30


gg_graph_ident_minor <- tibble(
  x = c(graph_minor_x_first, 100 - graph_minor_x_first),
  y = c(graph_y_first, graph_y_first),
  # colour = "secondary"
  colour = c("secondary", "tertiary")
) %>%
  ggplot() +
  annotate(
    "segment",
    x = graph_minor_x_first,
    xend = 100 - graph_minor_x_first,
    y = graph_y_first,
    yend = graph_y_first,
    linewidth = ident_linewidth + 2,
    colour = cols_gpcds$graph_tertiary_darker) +
  geom_point(aes(x, y, colour = colour),
           size = ident_disk_size * ident_minor_disk_factor,
           show.legend = FALSE) +
  scale_colour_manual(
    values = c(
      "secondary" = cols_gpcds$graph_secondary,
      "tertiary" = cols_gpcds$graph_tertiary
    )
  ) +
  scale_x_continuous(expand = c(0, 0)) +
  scale_y_continuous(expand = c(0, 0)) +
  coord_fixed(xlim = c(0, 100), ylim = c(0, 100)) +
  theme_void() +
  theme(
    panel.background = element_rect(
      fill = cols_gpcds$graph_primary,
      colour = cols_gpcds$graph_primary
    )
  )

ggsave(quarto_here("gg_graph_ident_minor.png"),
       gg_graph_ident_minor,
       width = 8,
       height = 8)
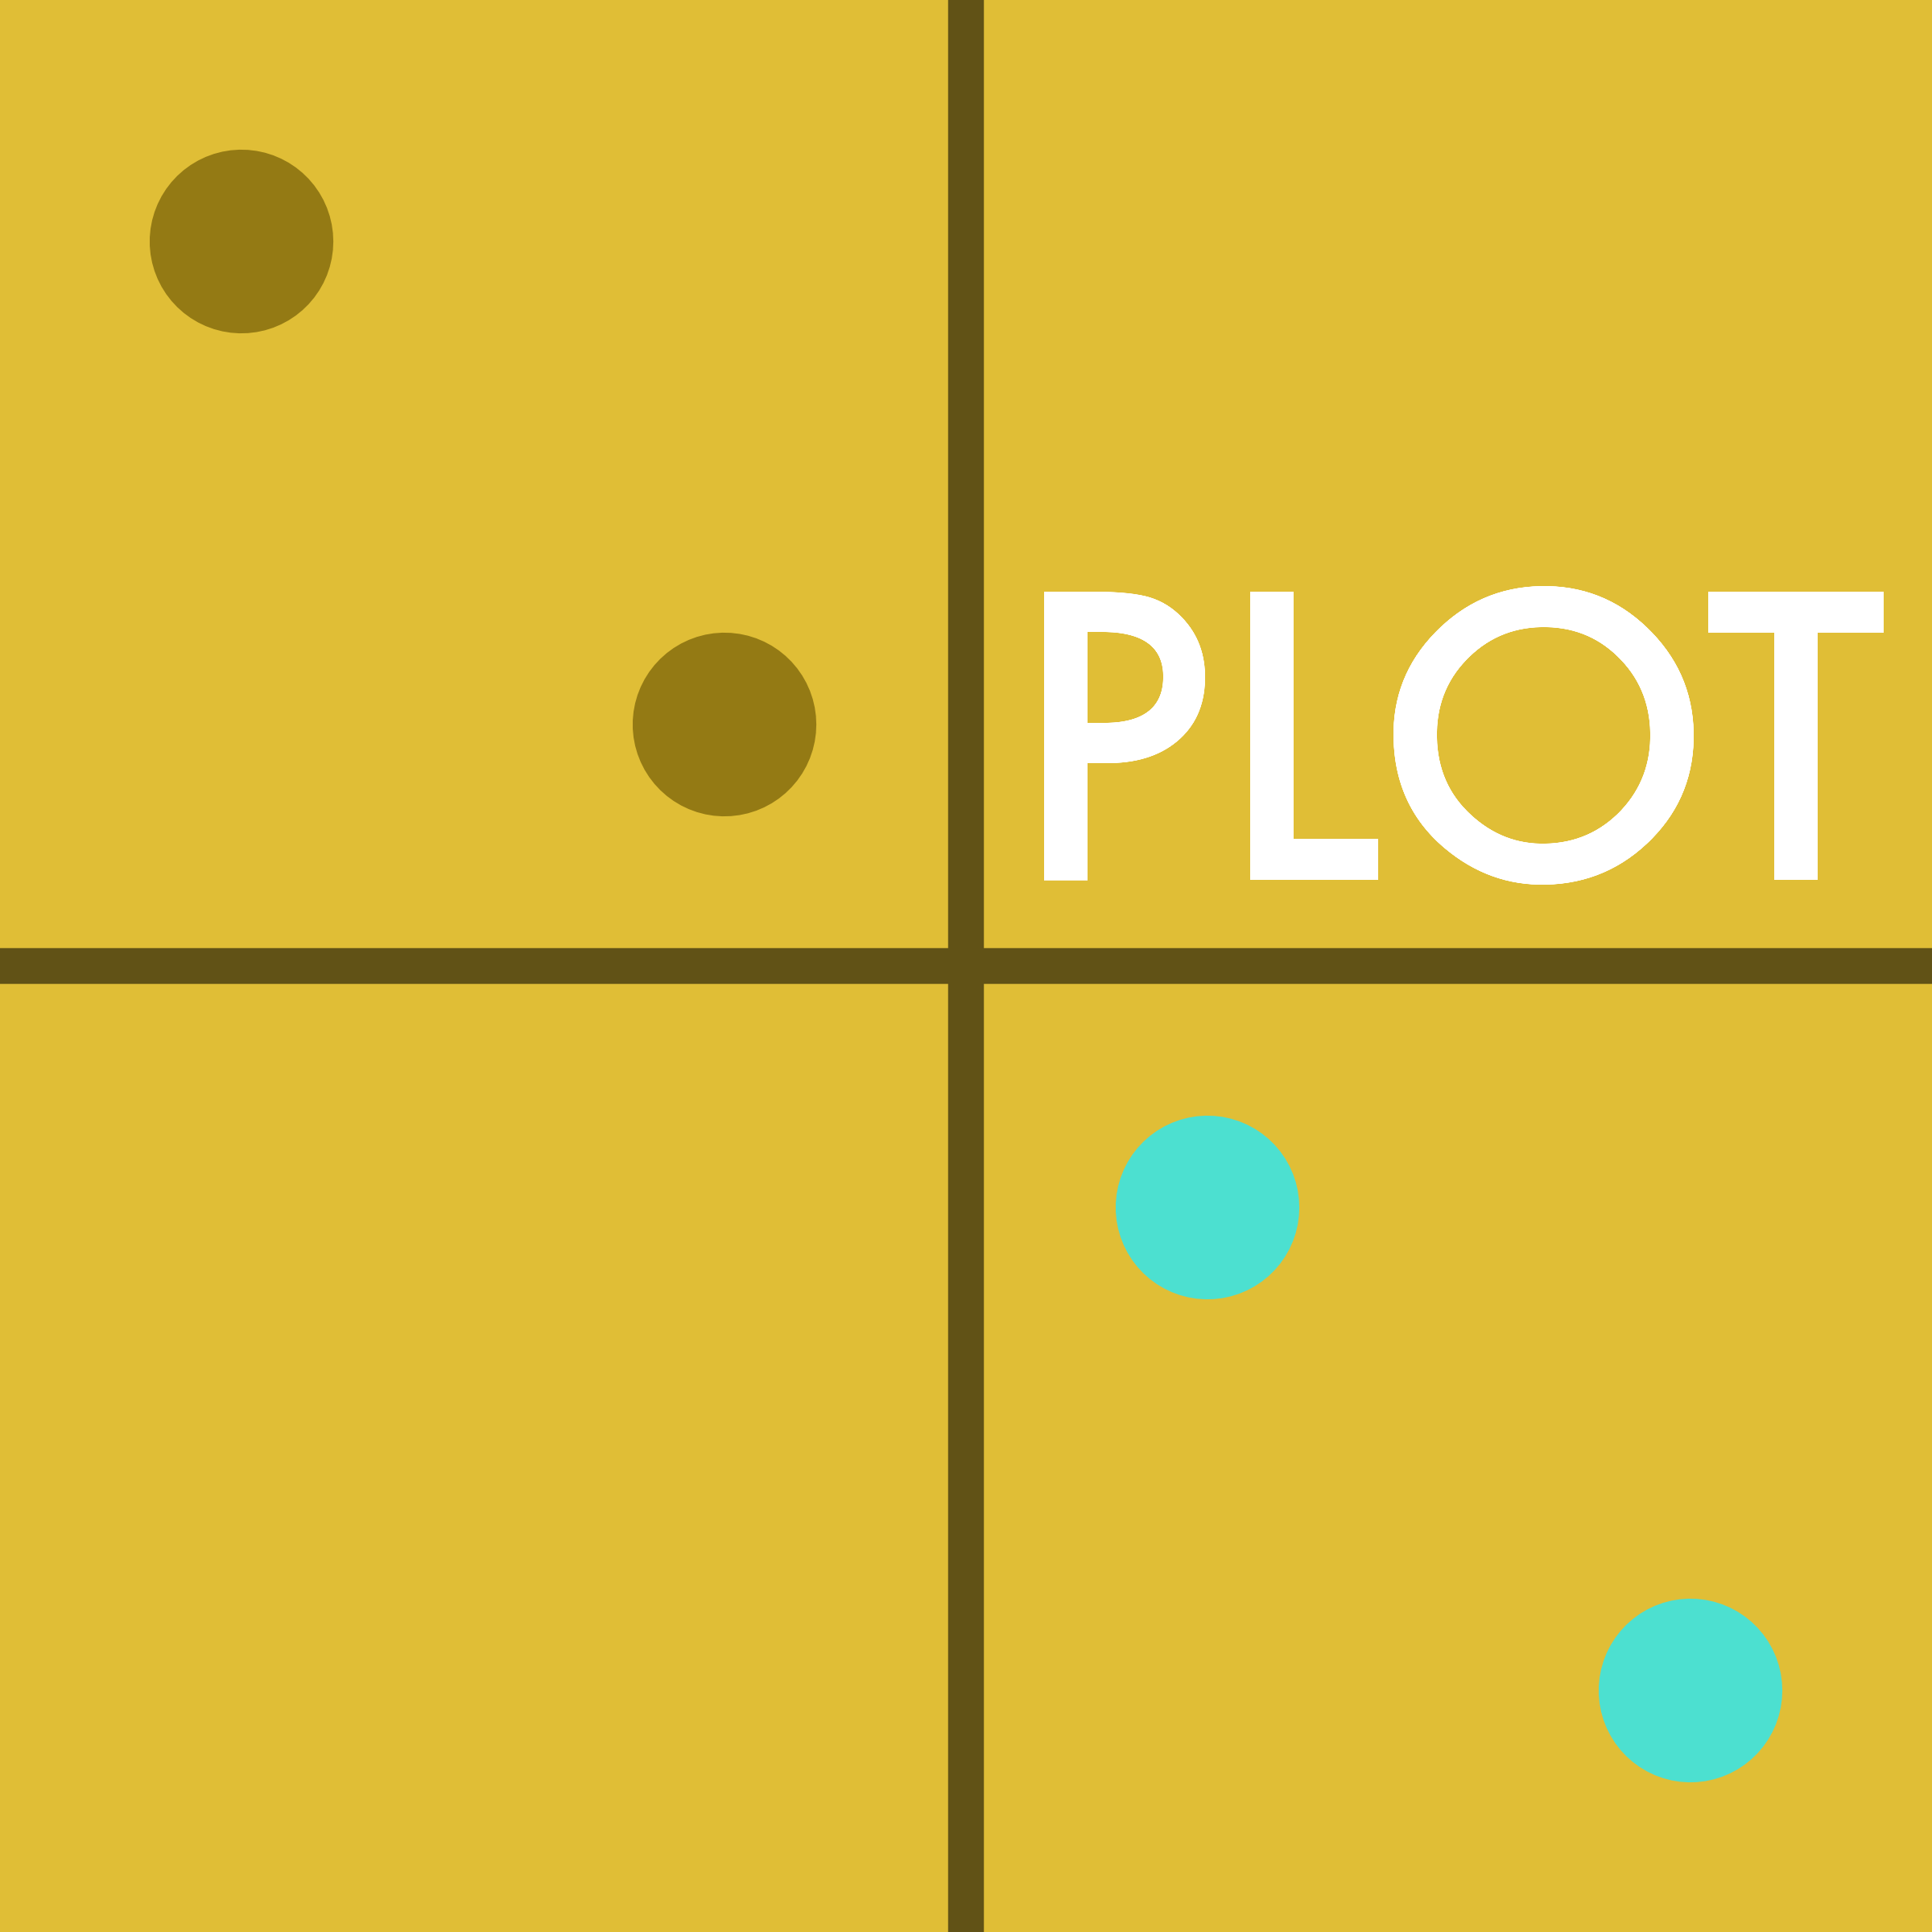
Plots
The plot idents are inspired by scatter plots. In the major ident the disks are placed on the line y = -x to enclose the idents in the four-wise arrangement. The word “plot” is displayed in the top-right corner as that’s the placement of the ident in the four-wise arrangement.
Code
gg_plot_ident_major <- tibble(
  x = c(12.5, 37.5, 62.5, 87.5),
  y = rev(c(12.5, 37.5, 62.5, 87.5)),
  colour = c("tertiary", "tertiary", "secondary", "secondary")
) %>%
ggplot() +
  geom_point(aes(x, y, colour = colour),
             size = ident_disk_size,
             show.legend = FALSE) +
  geom_text(
    x = 75,
    y = 62.5,
            label = "PLOT",
            size = ident_textsize,
            colour = "white",
            family = "Futura") +
  geom_vline(xintercept = 50,
             colour = cols_gpcds$plot_tertiary_darker,
             linewidth = ident_linewidth) +
  geom_hline(yintercept = 50,
             colour = cols_gpcds$plot_tertiary_darker,
             linewidth = ident_linewidth) +
  scale_colour_manual(values = c("secondary" = cols_gpcds$plot_secondary,
                               "tertiary" = cols_gpcds$plot_tertiary)) +
  scale_x_continuous(expand = c(0, 0)) +
  scale_y_continuous(expand = c(0, 0)) +
  coord_fixed(xlim = c(0, 100),
              ylim = c(0, 100)) +
  theme_void() +
  theme(panel.background = element_rect(fill = cols_gpcds$plot_primary,
                                        colour = cols_gpcds$plot_primary))

ggsave(quarto_here("gg_plot_ident_major.png"),
       gg_plot_ident_major,
       width = 8,
       height = 8)
Code
gg_plot_ident_minor <- tibble(
  x = c(30, 70),
  y = rev(c(30, 70)),
  colour = c("tertiary", "secondary")
) %>%
ggplot() +
  geom_point(aes(x, y, colour = colour),
             size = ident_disk_size * ident_minor_disk_factor,
             show.legend = FALSE) +
  scale_colour_manual(values = c("secondary" = cols_gpcds$plot_secondary,
                               "tertiary" = cols_gpcds$plot_tertiary)) +
  scale_x_continuous(expand = c(0, 0)) +
  scale_y_continuous(expand = c(0, 0)) +
  coord_fixed(xlim = c(0, 100),
              ylim = c(0, 100)) +
  theme_void() +
  theme(panel.background = element_rect(fill = cols_gpcds$plot_primary,
                                        colour = cols_gpcds$plot_primary))

ggsave(quarto_here("gg_plot_ident_minor.png"),
       gg_plot_ident_minor,
       width = 8,
       height = 8)
Charts
The chart idents are inspired by bubble charts, but could also be interpeted as something more complex. In the major ident all four of the smaller disks are placed on the lines y = ± x with the top-right disk placed off the “bubble” to bring the viewer’s gaze to the centre of the four-wise arrangement.
Code
library("ggforce")
chart_center_circle_coords <- list(x = 50, y = 50)
chart_center_circle_radius <- 37.5

# Solve (x - 50)² + (y - 50)² = 37.5² and y = x
chart_equ_solution <- 50 - 75 / {2 * sqrt(2)}

gg_chart_ident_major <- tibble(
  x = c(chart_equ_solution, 100-chart_equ_solution, 100 - 12.5, chart_equ_solution),
  y = c(100-chart_equ_solution, chart_equ_solution, 100 - 12.5, chart_equ_solution),
  colour = c("tertiary", "tertiary", "secondary", "secondary")
) %>%
  ggplot() +
  geom_circle(data = tibble(),
              aes(x0 = 50, y0 = 50, r = chart_center_circle_radius),
                linewidth = ident_linewidth,
                colour = cols_gpcds$chart_tertiary_darker) +
    geom_point(aes(x, y, colour = colour),
             size = ident_disk_size,
             show.legend = FALSE) +
  geom_text(
    x = 50,
    y = 50,
    label = "CHART",
    size = ident_textsize,
    colour = "white",
    family = "Futura"
  ) +
  scale_colour_manual(
    values = c(
      "secondary" = cols_gpcds$chart_secondary,
      "tertiary" = cols_gpcds$chart_tertiary
    )
  ) +
  scale_x_continuous(expand = c(0, 0)) +
  scale_y_continuous(expand = c(0, 0)) +
  coord_fixed(xlim = c(0, 100), ylim = c(0, 100)) +
  theme_void() +
  theme(
    panel.background = element_rect(
      fill = cols_gpcds$chart_primary,
      colour = cols_gpcds$chart_primary
    )
  )

ggsave(quarto_here("gg_chart_ident_major.png"),
       gg_chart_ident_major,
       width = 8,
       height = 8)
Code
chart_minor_center_circle_radius <- 37.5

# Solve (x - 50)² + (y - 50)² = 37.5² and y = x
chart_equ_solution <- 50 - 75 / {2 * sqrt(2)}

gg_chart_ident_minor <- tibble(
  x = 100 - chart_equ_solution,
  y = 100 - chart_equ_solution,
  colour = "secondary"
) %>%
  ggplot() +

    geom_circle(aes(x0 = 50, y0 = 50, r = chart_minor_center_circle_radius),
                linewidth = ident_linewidth,
                colour = cols_gpcds$chart_tertiary_darker,
                fill = cols_gpcds$chart_tertiary_darker) +
    geom_point(aes(x, y, colour = colour),
             size = ident_disk_size * ident_minor_disk_factor,
             show.legend = FALSE) +
  scale_colour_manual(
    values = c(
      "secondary" = cols_gpcds$chart_secondary,
      "tertiary" = cols_gpcds$chart_tertiary
    )
  ) +
  scale_x_continuous(expand = c(0, 0)) +
  scale_y_continuous(expand = c(0, 0)) +
  coord_fixed(xlim = c(0, 100), ylim = c(0, 100)) +
  theme_void() +
  theme(
    panel.background = element_rect(
      fill = cols_gpcds$chart_primary,
      colour = cols_gpcds$chart_primary
    )
  )

ggsave(quarto_here("gg_chart_ident_minor.png"),
       gg_chart_ident_minor,
       width = 8,
       height = 8)
Data Stories
The data story idents are designed to imply movement and include arrows which are not found in any other ident. In the major ident the arrows point to the centre of the ident itself instead of a position within the four-wise arrangement - to indicate that the story sometimes need to be centered over design.
Code
story_x_coords <- list(min = 15, max = 15 *3)
story_y_coords <- 20
story_arrow_y_adjustment <- 7.5
story_arrow_x_adjustment <- 2.5

gg_story_ident_major <- tibble(
  x = c(story_x_coords$min, story_x_coords$max, 100 - story_x_coords$min, 100 - story_x_coords$max),
  y = c(100 - story_y_coords, 100 - story_y_coords, story_y_coords, story_y_coords),
  colour = c("secondary", "tertiary", "secondary", "tertiary")
) %>%
  ggplot() +
    geom_point(aes(x, y, colour = colour),
             size = ident_disk_size,
             show.legend = FALSE) +
  annotate("curve",
           x = story_x_coords$min + story_arrow_x_adjustment,
           y = 100 - story_y_coords + story_arrow_y_adjustment,
           xend = story_x_coords$max - story_arrow_x_adjustment,
           yend = 100 - story_y_coords + story_arrow_y_adjustment,
           linewidth = ident_linewidth - 2,
           colour = cols_gpcds$story_tertiary_darker,
           arrow = arrow(length = unit(0.6, "cm"), type = "closed"),
           curvature = -0.5,
           ncp = 1000) +
  annotate("curve",
           x = 100 - story_x_coords$min - story_arrow_x_adjustment,
           y = story_y_coords - story_arrow_y_adjustment,
           xend = 100 - story_x_coords$max + story_arrow_x_adjustment,
           yend = story_y_coords - story_arrow_y_adjustment,
           linewidth = ident_linewidth - 2,
           colour = cols_gpcds$story_tertiary_darker,
           arrow = arrow(length = unit(0.6, "cm"), type = "closed"),
           curvature = -0.5,
           ncp = 1000) +
  geom_text(
    x = 50,
    y = 50,
    label = "DATA\nSTORY",
    size = ident_textsize,
    colour = "white",
    family = "Futura",
    lineheight = 0.9
  ) +
  scale_colour_manual(
    values = c(
      "secondary" = cols_gpcds$story_secondary,
      "tertiary" = cols_gpcds$story_tertiary
    )
  ) +
  scale_x_continuous(expand = c(0, 0)) +
  scale_y_continuous(expand = c(0, 0)) +
  coord_fixed(xlim = c(0, 100), ylim = c(0, 100)) +
  theme_void() +
  theme(
    panel.background = element_rect(
      fill = cols_gpcds$story_primary,
      colour = cols_gpcds$story_primary
    )
  )

ggsave(quarto_here("gg_story_ident_major.png"),
       gg_story_ident_major,
       width = 8,
       height = 8)
Code
story_minor_x_coords <- list(min = 25, max = 75)
story_minor_y_coords <- 20
story_arrow_y_adjustment <- 15
story_arrow_x_adjustment <- 2.5

gg_story_ident_minor <- tibble(
  x = as.numeric(story_minor_x_coords),
  y = c(50, 50),
  colour = c("secondary", "tertiary")
) %>%
  ggplot() +
    geom_point(aes(x, y, colour = colour),
             size = ident_disk_size * ident_minor_disk_factor,
             show.legend = FALSE) +
  annotate("curve",
           x = story_minor_x_coords$min + story_arrow_x_adjustment,
           y = 50 + story_arrow_y_adjustment,
           xend = story_minor_x_coords$max - story_arrow_x_adjustment,
           yend = 50 + story_arrow_y_adjustment,
           linewidth = ident_linewidth,
           colour = cols_gpcds$story_tertiary_darker,
           arrow = arrow(length = unit(0.6, "cm"), type = "closed"),
           curvature = -0.5,
           ncp = 1000) +
  annotate("curve",
           x = 100 - story_minor_x_coords$min - story_arrow_x_adjustment,
           y = 50 - story_arrow_y_adjustment,
           xend = 100 - story_minor_x_coords$max + story_arrow_x_adjustment,
           yend = 50 - story_arrow_y_adjustment,
           linewidth = ident_linewidth,
           colour = cols_gpcds$story_tertiary_darker,
           arrow = arrow(length = unit(0.6, "cm"), type = "closed"),
           curvature = -0.5,
           ncp = 1000) +
  scale_colour_manual(
    values = c(
      "secondary" = cols_gpcds$story_secondary,
      "tertiary" = cols_gpcds$story_tertiary
    )
  ) +
  scale_x_continuous(expand = c(0, 0)) +
  scale_y_continuous(expand = c(0, 0)) +
  coord_fixed(xlim = c(0, 100), ylim = c(0, 100)) +
  theme_void() +
  theme(
    panel.background = element_rect(
      fill = cols_gpcds$story_primary,
      colour = cols_gpcds$story_primary
    )
  )

ggsave(quarto_here("gg_story_ident_minor.png"),
       gg_story_ident_minor,
       width = 8,
       height = 8)
Logos
We went through many iterations of our logo where we tried to include the same design elements as the idents but they were too complex. Through lots of sketches we arrived at this triplet of full colour, black on white and white on black logos.
An older generation of our logo with far too much going on.

Code
x0_small_dot_center <- 500 + (1000 / (1.618 * 2 * sqrt(2)))
r_small_dot <- 1000 / {1.618 * 2 * 3}
linewidth_circles <- 5

degree_change <- 8
func_graph_line  <- function(x) tan({45 + degree_change} * pi / 180) * x + r_small_dot + linewidth_circles * 2

func_story_line  <- function(x) tan({45 - degree_change} * pi / 180) * x - tan({45 - degree_change} * pi / 180) * {r_small_dot + linewidth_circles * 2}

gg_logo_colour <- ggplot() +
  aes(xmin = -1000, xmax = 2000, y = -1000, ymax = 2000) +
  geom_ribbon(stat = 'function', fun = func_story_line,
              mapping = aes(ymin = after_stat(y), ymax = Inf, x = 1000),
              fill = cols_gpcds$other_primary) +
  geom_ribbon(stat = 'function', fun = func_graph_line,
              mapping = aes(ymin = after_stat(y), ymax = Inf, x = 1000),
              fill = cols_gpcds$graph_primary) +
  geom_ribbon(stat = 'function', fun = func_story_line,
              mapping = aes(ymin = after_stat(y), ymax = -Inf, x = 1000),
              fill = cols_gpcds$story_primary) +
  # geom_function(fun = func_story_line,
  #               colour = cols_gpcds$story_tertiary_darker,
  #               linewidth = linewidth_circles) +
  # geom_function(fun = func_graph_line,
  #               colour = cols_gpcds$story_tertiary_darker,
  #               linewidth = linewidth_circles) +
  geom_circle(aes(x0 = 500,
           y0 = 500,
           r = 1000 / {1.618 * 2}),
           fill = cols_gpcds$chart_primary,
           linewidth = linewidth_circles,
           # linewidth = 0,
           colour = cols_gpcds$story_tertiary_darker) +
  geom_circle(aes(
    x0 = x0_small_dot_center,
    y0 = x0_small_dot_center,
    r = r_small_dot),
    fill = cols_gpcds$plot_primary,
    linewidth = linewidth_circles,
    linewidth = 0,
    colour = cols_gpcds$story_tertiary_darker) +
  scale_x_continuous(expand = c(0, 0)) +
  scale_y_continuous(expand = c(0, 0)) +
  coord_fixed(xlim = c(0, 1000),
                  ylim = c(0, 1000)) +
  theme_void()
Code
gg_logo_black_on_white <- ggplot() +
  aes(xmin = 0, xmax = 10, y = 0, ymax = 10) +
  geom_ribbon(stat = 'function', fun = func_story_line,
              mapping = aes(ymin = after_stat(y), ymax = Inf, x = 1000),
              fill = cols_gpcds$black_alterative) +
  geom_ribbon(stat = 'function', fun = func_graph_line,
              mapping = aes(ymin = after_stat(y), ymax = Inf, x = 1000),
              fill = "white") +
  geom_ribbon(stat = 'function', fun = func_story_line,
              mapping = aes(ymin = after_stat(y), ymax = -Inf, x = 1000),
              fill = "white") +
  geom_circle(aes(x0 = 500,
                  y0 = 500,
                  r = 1000 / {1.618 * 2}),
              fill = cols_gpcds$black_alterative,
              linewidth = linewidth_circles,
              colour = "white") +
  geom_circle(aes(
    x0 = x0_small_dot_center,
    y0 = x0_small_dot_center,
    r = r_small_dot),
    fill = "white",
    linewidth = linewidth_circles,
    colour = "white") +
  scale_x_continuous(expand = c(0, 0)) +
  scale_y_continuous(expand = c(0, 0)) +
  coord_fixed(xlim = c(0, 1000),
              ylim = c(0, 1000)) +
  theme_void()
Code
gg_logo_white_on_black <- ggplot() +
  aes(xmin = 0, xmax = 10, y = 0, ymax = 10) +
  geom_ribbon(stat = 'function', fun = func_story_line,
              mapping = aes(ymin = after_stat(y), ymax = Inf, x = 1000),
              fill = "white") +
  geom_ribbon(stat = 'function', fun = func_graph_line,
              mapping = aes(ymin = after_stat(y), ymax = Inf, x = 1000),
              fill = cols_gpcds$black_alterative) +
  geom_ribbon(stat = 'function', fun = func_story_line,
              mapping = aes(ymin = after_stat(y), ymax = -Inf, x = 1000),
              fill = cols_gpcds$black_alterative) +
  geom_circle(aes(x0 = 500,
                  y0 = 500,
                  r = 1000 / {1.618 * 2}),
              fill = "white",
              linewidth = linewidth_circles,
              colour = cols_gpcds$black_alterative) +
  geom_circle(aes(
    x0 = x0_small_dot_center,
    y0 = x0_small_dot_center,
    r = r_small_dot),
    fill = cols_gpcds$black_alterative,
    linewidth = linewidth_circles,
    colour = cols_gpcds$black_alterative) +
  scale_x_continuous(expand = c(0, 0)) +
  scale_y_continuous(expand = c(0, 0)) +
  coord_fixed(xlim = c(0, 1000),
              ylim = c(0, 1000)) +
  theme_void()
To give meaning to this design, here are the design choices we used
Golden ratio sizes. The largest disc is sized at
logo_diameter / {1.618 * 2}and the smaller disc islogo_diameter / {1.618 * 2 * 3}There’s a small optical illusion where the green stripe appears quite thin at the bottom left but is actually sized by dragging the smaller disc into the corner.
The green stripe has angles of 45±8 degrees.
Lettermark
Our combination mark was designed before the lettermark in Canva:

We’ve tried to replicate the lettermark directly here with HTML and CSS but unfortunately cannot get the font-weight to affect the letters:
G|P|C|DS
Favicon
Favicons are miniture versions of the logo used for website icon etc. By abandoning the ident design elements for the logo we have managed to produce a design that scales all the way down to 32x32 pixels with a slight tweak to the linewidth of the discs.
